Unlike conventions assets and financial instruments, options offer investors and traders greater levels of flexibility with regards to taking advantage of the prevailing market conditions, seasons tendencies, volatility disparity and much more. Technical analysis in options trading plays a vital role for investors and options traders when making their investment and trading decisions. Most options traders and investors forecast the 3 types of price movement and accordingly opt for buying or selling calls and puts. The three different price movement option traders anticipate are as follows:
Strong Directional Movement
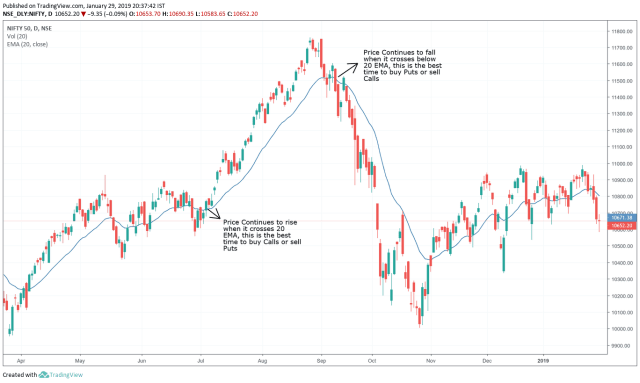
The 20-days exponential moving average is considered as the best method finding candidates who are moving at a rapid pace. The exponential moving average is much more responsive when compared to the traditional moving average as it places a higher weight on the recent price, as a result, makes it an excellent choice to aid the trader to evaluate the strength of the trend.
Another good tool for technical analysis in options trading is the 90-day price highs. As per several backtests, the financial assets which reach their 90-day highs are likely to continue moving in the same direction with an increased level of momentum. A large section of traders believes that stock and other financial assets that are priced too high while trading over its 90-day price high, but most major price breakouts which continue to several weeks, all start by breaking its 90-day price high.
Also Read: Options Trading Courses Online
Mild Directional Movement
This form of price movement is generally the results from a pullback, a bounce or a continuation in the momentum post a pause. This prices movement generally take place during an existing trend when the market pauses the momentum and re-balances before the momentum continuing towards the main trend.
An easy and effective method to identify a mild directional momentum in options is identifying the assets which are pulling back during a strong upwards trend. The Relative Strength Index is an indicator which works well for such analysis. While there are many oscillators which are similar to the Relative Strength Index indicator, most of these oscillators can be very sensitive to price date and as a result, generate excessive false signals. Mild direction movements are perfect for option spreads and combination strategy.
No Directional Movement
Many times the options traders and investors, primarily premium sellers desire little or no directional movement. This is because they wish to exploit the premium decay. Likewise, when option traders sell premium, these traders desire a higher volatility level, which helps in increasing the premium the options selling brings in. This is due to a sharp rise in the implied volatility which expands with an increase in volatility.
Use Bollinger Bands for Options Trading
Another method for technical analysis in options trading used by traders to identify a range bound market using the Bollinger Band indicator. When the Bollinger Band envelope expands, it indicates an increase in volatility and the narrowing of the Bollinger Bands indicate a reduction of volatility and market is on track of becoming range bound. Most options traders sell options when these bands widen and buy options when the bands become narrow.
Another method traders use the Bollinger Band as support and resistance level while selling premiums outside the lower and upper bands of the envelope, as these levels provide fairly conservation levels of trading, both for the downside and the upside.
Also Read: Technical Analysis vs Fundamental Analysis: A Detailed Comparison
Conclusion
To conclude, there are a wide array of indicators, tools and techniques, price patterns, and each these tool function best in different market scenarios and conditions. The selection of a method or indicator for technical analysis in options trading needs to take into consideration the price movement anticipated by the trader, their options strategy they wish to utilize and the volatility level of the underlying asset and the prevailing time.


Please provide access.