Candlestick Pattern analysis is one of the foundation stones for technical analysis of stock charts. Every candle in the chart speak volumes of the underlying market sentiment. Mastering the art to read candles takes time and patience, but once achieved can help you immensely. There are hundreds of candlestick patterns the exist, but obviously you cannot look for all these patterns in chart. In this post, we have consolidated some of the most powerful candlestick patterns that you must know. Go ahead and try to spot these patterns on different charts and timeframes.
BULLISH AND BEARISH ENGULFING

This is probably one of the most powerful candlestick patterns which is widely popular among traders. It is characterized by a short candle followed by a long candle. The long candle completely engulfs the short candle.The bullish engulfing formation consists of a short red candlestick followed by a taller green bodied candlestick that begins below and ends above the previous day’s trading range.This means prices on the second day opened lower than the first and closed higher. This is a highly bullish formation and indicates a long position should be considered. A bearish engulfing pattern would be the opposite with a green bodied candlestick followed by a longer redbodied candlestick. Here the signal is bearish and consideration should be made for selling short.
DOJI CANDLE
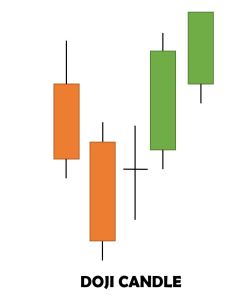
Doji Candle formation is yet another important reversal indicator. It has no or very minimum body area which indicates that open and close are same. The length of the upper and lower shadows can vary and the resulting candlestick looks like a cross, inverted cross or plus sign. A Doji formation in downtrend (as shown in above picture) can possibly reverse the trend into sideways or uptrend. And similarly, Doji formation in uptrend can too cause reversal. Doji indicates a state of confusion between buyers and sellers, a point where buyers are exhausted during uptrend and sellers are ready to pitch in, and vice versa. There are different variations of Doji like Dragonfly Doji and Gravestone Doji.
THREE BLACK CROWS

This is a bearish reversal pattern that occurs at the high of uptrend. It is characterized by three red or black candles each having a lower low than the previous one. These 3 candles have long bodies and significant volume in terms of participation. Such formation is rare but it clearly indicates high probability of sustained downtrend.
BULLISH AND BEARISH MARUBOZU

These are one of the most convincing candlestick formations. Marubozu do not have upper or lower shadows and the high and low are represented by the open or close. A Green Marubozu forms when open is equal to low and close is equal to high. This indicates that buyers are in control from trade start time to end time of timeframe. Red Marubozu form when open is equal to high and close is equal to low. This indicates that sellers are in control from start time to end time of timeframe.
HAMMER

Hammer is a bullish candlestick pattern that appears after a sustained downtrend. It has a small green body with a long lower wick. It indicates the sellers tried to take price downwards but at the end buyers gained control at the end of session. While this may seem enough to act on, hammers require further bullish confirmation. The low of the hammer shows that plenty of sellers remain. Further buying pressure, and preferably on expanding volume, is needed before acting. Such confirmation could come from a gap up or long white candlestick. A Hammer like candle formation at the uptrend is known as Hanging Man. It indicates possible reversal to a downtrend.
These were the top 5 most powerful candlestick patterns we have analyzed. They have high probability of winning and used by many traders across the globe. However, it does not mean that other patterns can be overlooked. There are many more patterns which should be considered to take positions in market. Please let us know if you have any questions or if you want to add any other pattern in this list.
Read about another interesting chart pattern below:
Hi Sir
Is it possible to code to detect these patterns in AFL for amibroker exploration in live charts on smaller time frames? this would be very useful for the users.
i found few on net however none of them are actually working in reality.
Hi Venkatesh,
We would try to create such AFL.
@Venkatesh, hammer detection afl is there with amibroker only. You have to approach them.